The Hidden Cost of Stock Investing: Why Your Time Might Be Your Biggest Risk
Most investors focus on picking the right stock—but ignore their biggest cost: time. Learn why time is your greatest risk and how to minimize it without sacrificing returns.
STOCKSINVESTINGPASSIVE INCOMEEDITOR'S PICKS
Garrett Duyck
4/2/20269 min read
Quick Navigation: Explore the blog | Active Income | Passive income | job SHaming | Stairstep retirement


I've spent years studying how money works and building passive income streams, and one of the biggest lessons I've learned is this: time and money are inseparable. It takes time to make money. But money cannot buy more time. That means every hour you spend on an investing activity needs to earn its keep.
In this article, I'm going to walk you through a concept that changed how I think about stock investing. We'll look at the real math behind the time you spend picking stocks, why most retail investors would be better off doing almost nothing, and what you can do to tilt the odds in your favor if you still want to pick stocks for alpha.
The Benchmark That Requires Zero Effort
Before we talk about the cost of your time, we need to establish a baseline. The baseline that I use is the performance of the S&P 500 Index.
The S&P 500 is a collection of the 500 largest publicly traded companies in the United States. Over the last 50 years, it has delivered an average annual return of approximately 11.71%, including reinvested dividends. Over the last 100 years, that number is 10.42% (TradeThatSwing).
Here's the part that matters for our discussion: you can realize that return (both ups and downs) with virtually zero effort or time.
You open a brokerage account.
You buy a low-cost S&P 500 index fund.
You set up automatic contributions.
Done.
It may take 30 minutes of work per year. That's your benchmark. That's the return you get for free in terms of your time. Every single hour you spend trying to do better than the S&P 500 needs to be measured against this reality, against this benchmark.
What Is Alpha, and Why Should You Care?
In investing, alpha is the fancy term for the extra return you generate above a benchmark. If the S&P 500 returns 10% and your stock picks return 13%, your alpha is 3% (13 - 10 = 3).
Alpha is the only reason to pick individual stocks. If you can't generate alpha, you're working to lose money.
And the research on this is sobering. According to the efficient market hypothesis, stock prices already reflect all available information, making it nearly impossible to consistently find mispriced assets. Studies show that fewer than 10% of professional, active fund managers achieve positive alpha over a decade or more after fees (Investopedia).
These are professionals. People with teams of analysts, algorithmic tools, Bloomberg terminals, and decades of experience. If they can't beat the market consistently, what chance does someone researching stocks on their couch after the kids go to bed have?
The truth: almost none.
That's not a rhetorical dig. It's a genuine question every stock investor needs to sit with. I have spent decades learning how to produce alpha, and I spent years writing about my process on Seeking Alpha, the crowdsourced platform dedicated to the subject. I learned what works, mostly what doesn't work, and I wasted a lot of time doing so. Now, I'm here to save you some time.
The Math Nobody Does: Your Time-Adjusted Return
We need to talk about the hidden cost to stock investing that kills alpha: time-adjusted returns. Let me walk you through a simple example that I think every stock investor should calculate for themselves.
Scenario: The Weekend Stock Picker
Let's say you spend 5 hours per week researching stocks. Reading earnings reports, watching analysis videos, scanning screeners, and reading financial news. That's 260 hours per year.
Your portfolio is $50,000, and you manage to outperform the S&P 500 by 2%. That means your alpha generated is:
$50,000 × 2% = $1,000 in extra returns
Now divide that by your hours:
$1,000 ÷ 260 hours = $3.85 per hour
You just valued your investing research time at less than minimum wage. Without accounting for the value of what you learned, you would be better off just working a job or side hustle to earn more.
And remember: this assumes you actually outperformed, which statistically most investors don't. The average equity fund investor earned 16.54% in 2024, while the S&P 500 returned 25.02%. That's an 8.48 percentage point gap, the second-largest underperformance in a decade (DALBAR/PR Newswire).
If you underperform, you didn't just waste your time. You paid for the privilege of losing money. Ouch.
Don't get me wrong; I've been there more than I care to admit.
Now flip the scenario. Same 260 hours, but a $500,000 portfolio:
$500,000 × 2% = $10,000 ÷ 260 hours = $38.46 per hour
Better. But still not great for a skilled professional's time.
Now imagine a $5,000,000 portfolio:
$5,000,000 × 2% = $100,000 ÷ 260 hours = $384.62 per hour
Now we're talking.
The Economy of Scale Problem
This is the part that most retail investors never think about, and it changed how I approach my own portfolio.
It takes the same amount of time to research a stock whether you invest $100 or $100 million.
The 10 hours you spend analyzing a company do not change based on your position size. The research is the research. But the financial reward scales directly with the dollars you put to work.
This is why Wall Street firms spend millions on research teams. When you're managing billions, even a fraction of a percent of alpha translates to enormous profits. The math works at scale.
For most retail investors with portfolios under $100,000, the math is brutal. Your time cost overwhelms any realistic alpha you might generate. The economies of scale are working against you.
This isn't a reason to give up on investing. It's a reason to be strategic about how you invest your time. This is why we launched our Stock Portfolio Simulator with built-in time-adjusted return calculations. When you track your stock trades virtually in our simulator and input your time spent on research, it will automatically calculate your time-adjusted returns.
Why Most Retail Investors Underperform (It's Not What You Think)
Here's what DALBAR's research shows about why individual investors consistently lag the market. It's not bad stock picks. It's behavior.
The biggest culprits:
Panic selling during downturns, locking in losses, then missing the recovery
Chasing performance by buying after a stock has already run up
Short holding periods: historically, equity mutual fund investors rarely stay invested for more than four years
Emotional decision-making driven by loss aversion, herding, and media response
Over a 20-year period, the average equity investor realized an annualized return of 8.7%, compared to the S&P 500's 9.7%. That 1% annual gap sounds small. But on a $1 million portfolio, it means $1 million less in wealth over 20 years ($6.3 million vs. $5.3 million) (Zacks Investment Management). That's 18.8% more money for a 1% alpha.
Warren Buffett puts it simply: "Price is what you pay. Value is what you get." He doesn't try to time the market. He tries to find undervalued securities and hold them, ideally forever. His favorite holding period? "Forever."
Most retail investors do the opposite. They trade frequently, react emotionally, and end up paying for the privilege.
So What's the Answer? Speed.
Though it is difficult to beat the index and generate alpha, it's not impossible. As Warren Buffett says, "I'd be a bum on the street with a tin cup if the markets were always efficient." What he means is that he makes his money by selecting good stocks.
If the math shows that time is the enemy of alpha, the solution is to compress the time required to make high-quality investment decisions as much as possible.
The key to success as a stock investor isn't spending more time. It's about accessing the highest-quality information as quickly as possible.
Think about it this way. The market is incredibly efficient at pricing in available information. Professional investors with massive research teams are competing to find mispricings. Your edge as a retail investor isn't going to come from reading more 10-K filings. It's going to come from using the right tools to surface the information that matters most, fast. It won't always produce superior results, but with practice and experience, it can be achieved. That's what I have learned to do.
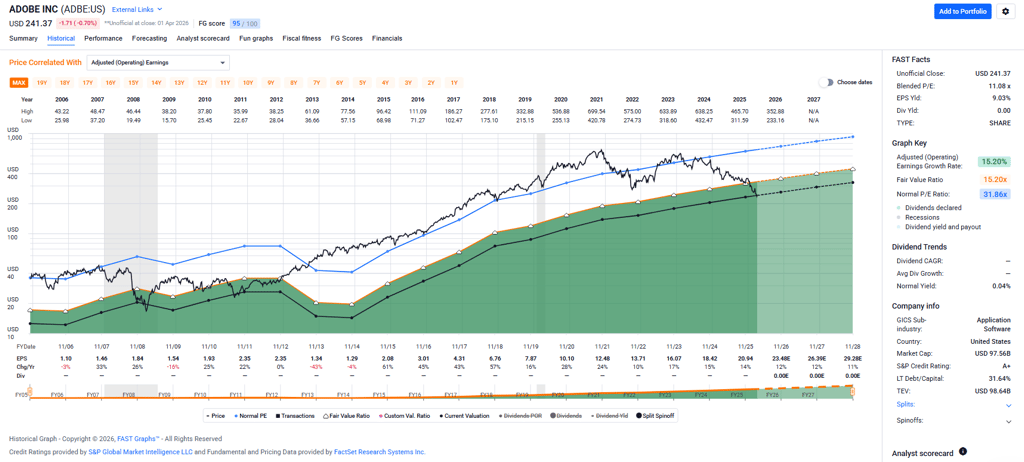
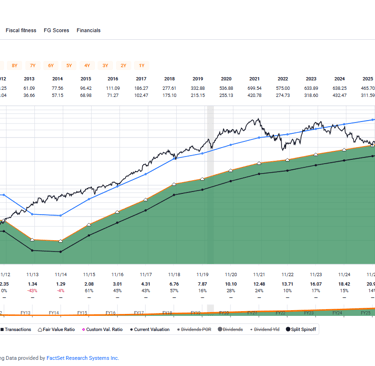
This is why I use FAST Graphs in my own investment process.
FAST Graphs does something that would take me hours to do manually: it plots a company's earnings, price, and valuation history on a single chart. Within seconds, I can see whether a stock is trading above or below its historical earnings relationship. I can see analyst forecasts for future earnings growth. I can check dividend history, payout ratios, and free cash flow.
The screenshot above shows the FAST Graph for Adobe Inc. ($ADBE). I can determine in 10 seconds whether ADBE is priced attractively by examining its price relative to its normal P/E (blue line) and fair value ratio (orange line). This critical first step allows me to screen stocks before continuing my research, saving countless hours. What used to take me an entire evening of spreadsheet work now takes mere seconds.
That's the shift. Not working harder. Working smarter. If you're going to pick individual stocks, your most important investment isn't in any company. It's in tools that reduce your time cost.
If you want to try it, you can get 25% off FAST Graphs with code AFFILIATE25.
Getting Started Without the Complexity
If you've read this far and you're thinking, "This is great, but I don't even have a brokerage account yet," then let me simplify your next step.
Before you worry about alpha, time costs, or stock analysis tools, you need a place to invest. I recommend TastyTrade as a solid option for getting started. They make it straightforward to open an account, and right now they're offering up to $100 when you open and fund a new account. That's a nice head start.
I've used TastyTrade for years and love the platform's features. It's my go-to options brokerage account. Once you have an account funded, you can start with an S&P 500 index fund (your zero-effort baseline) and then layer in individual stock picks as you build your skills and your toolkit.
Key Takeaways
Your time is your most limited resource. Every hour spent on stock research needs to generate enough alpha to justify that hour.
The S&P 500 gives you ~10-11% annual returns for essentially zero time. That's your benchmark, and it's hard to beat.
Most retail investors underperform the market by 1-8+ percentage points per year, primarily because of behavioral mistakes rather than bad stock picks.
The economies of scale are real. The same research effort produces wildly different per-hour returns depending on portfolio size.
Speed is the edge. If you're going to pick stocks, invest in tools like FAST Graphs that compress research time while maintaining quality.
If this got you thinking differently about how you approach investing, you'll want to read What Makes a Good Dividend Growth Stock (And Why Yield Alone Isn't Enough). In that article, I walk through real case studies, including one stock that turned a 3.5% yield into a 4% yield on cost with 300% capital gains, and another that looked like an incredible bargain but turned into a painful lesson.
If you want more of this content sent straight to your inbox, join my newsletter where I share what I'm buying, what I'm researching, and what I'm learning, all while making it home for dinner and bedtime stories with my kids.
If someone told you that spending time researching stocks could actually lose you money, would you believe them?
Most people wouldn't. We've been taught that hard work pays off. That more research means better decisions. That the investor who reads the most annual reports wins. But here's the thing about stock investing that almost nobody talks about: your time has a cost, and most investors never account for it.
Affiliate Disclosure: This article contains affiliate links. If you sign up for FAST Graphs or TastyTrade through the links above, I may receive compensation at no additional cost to you. I only recommend tools and platforms I personally use and believe provide genuine value. Your support helps keep CheatCode Wealth running.
Disclaimer: This article is for educational and informational purposes only and should not be construed as financial advice. I am not a licensed financial advisor. All investing involves risk, including the possible loss of principal. Past performance does not guarantee future results. Please consult with a qualified financial professional before making any investment decisions.
Garrett Duyck is the founder of CheatCode Wealth and the writer behind the Portfolios & Bedtime Stories newsletter. He writes for employed people who want to build wealth without quitting their job, burning out, or missing out on life. Garrett is a former contributor to Seeking Alpha, where he built an audience of more than 4,000 readers, and he has published more than 140 articles about investing, passive income, and personal finance. He was among the top 20% of analysts according to TipRanks.
He has built a portfolio of income-producing assets that generates more than $50,000 per year in passive income, and he and his wife have paid off more than $180,000 in non-mortgage loans while raising four children. Garrett grew up in poverty, became a first-generation college graduate, and believes the best money strategies are the ones real families can actually stick with over time.
Educational Disclosure: CheatCode Wealth content is for educational and informational purposes only. It is based on personal experience, research, and firsthand investing practice. It is not personalized financial, legal, tax, or investment advice. Always perform your own due diligence and consult with a licensed professional before making significant financial decisions.
Affiliate Disclosure: To support the site, some links in our articles may be affiliate links. If you click on these and make a purchase, CheatCode Wealth may receive a small commission at no additional cost to you. We only recommend tools and services that Garrett has personally used or thoroughly vetted for the CheatCode community.
New to CheatCode Wealth? Start with our Paycheck-to-Passive guide to see how we build the foundation.
Connect & Explore:
Learn more about Garrett · Explore wealth-building tools · Garrett’s Seeking Alpha Archive · Connect on LinkedIn
About the Author
Subscribe to the newsletter and get a free copy of 101 Money Cheat Codes:
Spam-free. Unsubscribe anytime.
CheatCode Wealth™
Build your wealth. Keep your life.
© 2025. All rights reserved. Cheatcode Wealth LLC. This webpage may contain paid affiliate links.