What Makes a Good Dividend Growth Stock (And Why Yield Alone Isn't Enough)
A high dividend yield can be a trap. Learn what separates great dividend growth stocks from dangerous yield traps using real case studies with actual numbers.
STOCKSINVESTING
Garrett Duyck
4/2/202610 min read
Quick Navigation: Explore the blog | Active Income | Passive income | job SHaming | Stairstep retirement


Let me tell you about two stocks I analyzed that both looked like incredible deals. One turned a modest investment into a 300%+ gain with a growing income stream. The other looked even better on paper, with a yield of over 10%, and it nearly wiped out.
Same investor. Same process. Same goal. Very different outcomes.
The difference wasn't luck. It was understanding what actually makes a dividend stock worth owning, and learning the hard way that yield alone isn't enough.
If you're building passive income through dividend stocks (and I think it's one of the most accessible paths to financial independence), this article will save you from a mistake I see beginner investors make over and over. We'll cover the three things that actually matter in a dividend growth stock, walk through real examples with real numbers, and talk about a concept called yield on cost that shows why a "boring" 2% yield today can become a 10% yield on your original investment over time.
The Yield Trap: Why High Yield Can Be a Warning Sign
When you're new to dividend investing, it's natural to sort by yield and gravitate toward the highest numbers. A stock yielding 8% sounds twice as good as one yielding 4%, right?
Not at all. And usually, it's the opposite.
A dividend yield is calculated by dividing the annual dividend by the current stock price. Here's the part people miss: yield goes up when price goes down. If a stock drops from $100 to $50 and the dividend stays the same, the yield doubles. That doesn't mean it's a better investment. It might mean the market is telling you something is wrong.
High yields can signal:
Deteriorating business fundamentals that the market is pricing in
An unsustainable payout ratio where the company is paying out more than it earns
A dividend cut on the horizon that will destroy the yield you were chasing
Declining earnings that will eventually force management's hand
This doesn't mean every high-yield stock is a trap. Some business structures necessitate a high payout, resulting in a high yield, such as REITs or MLPs. But it means you need to look deeper. Much deeper.
The Three Pillars of a Great Dividend Growth Stock
After years of studying dividend stocks, I've come to focus on three things that matter far more than the current yield number.
1. Earnings Growth (The Engine)
Dividends are paid from earnings. If earnings aren't growing, dividends eventually stagnate or get cut. It's that simple.
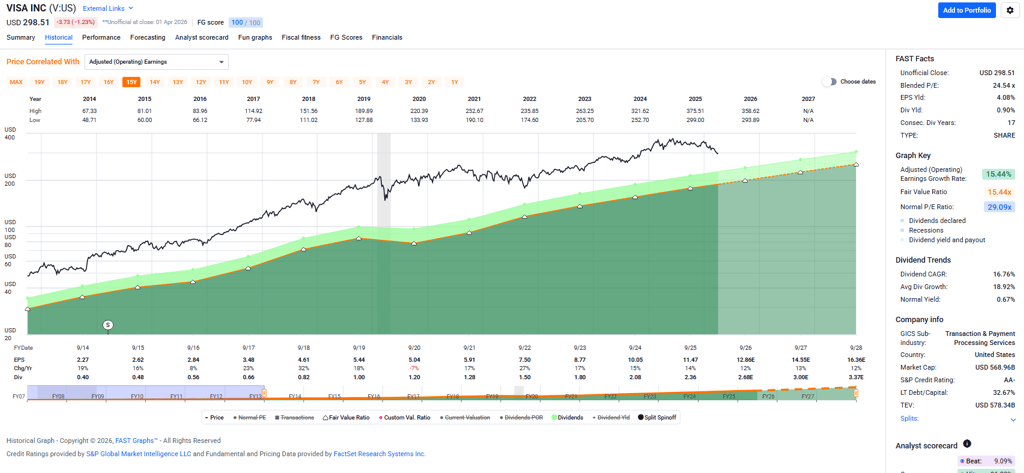
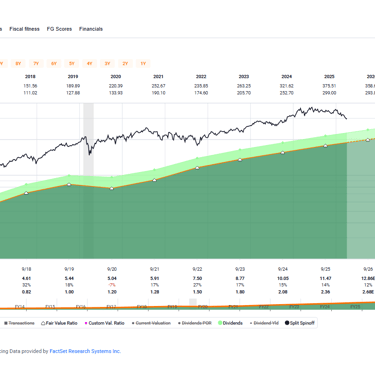
What you want to see is a company with a track record of consistent or growing earnings, and analyst forecasts that suggest the trend will continue. The earnings trajectory is the single most important factor in dividend growth investing.
The FAST Graph of Visa Inc. ($V) above shows how steadily growing earnings (orange line) correspond with steadily growing dividends (lime green). This is how dividend growth works at its finest.
2. Payout Ratio (The Ceiling and Floor)
The payout ratio tells you what percentage of earnings a company distributes as dividends. A payout ratio of 35% means the company keeps 65% of earnings for reinvestment, debt reduction, or a rainy day.
General guidelines:
Under 50%: Strong safety margin. Plenty of room for dividend growth.
50-70%: Moderate. Sustainable for mature, stable companies.
Over 75%: Caution. Less room for error. If earnings dip, the dividend may be at risk.
Over 100%: Red flag. The company is paying out more than it earns. This is unsustainable.
The payout ratio tells investors two important things:
How much of the company's earnings is going out as dividends.
How much room the dividend has to grow.
When a company has matured and is paying out a large portion of earnings as dividends, 50% or greater, it shows that the company will have difficulty growing earnings through reinvestment and that growth will need to come from issuing debt or equity instead of investing cash. When companies reach this stage of maturity, it generally indicates that the business model has reached its climax.
A low payout ratio, on the other hand, indicates that the company can, over time, raise its dividend. Growing earnings and growing dividends compound to create exponential returns for shareholders.
3. Valuation Relative to Earnings (The Entry Point)
A great company at the wrong price is a mediocre investment. What you want is a quality dividend grower trading at a fair earnings multiple.
This is where the concept of P/E compression becomes your friend. When a stock's price-to-earnings ratio drops below its historical average without a corresponding decline in earnings quality, there is a potential opportunity.
This is also where having the right tools makes an enormous difference in your time and accuracy. In my article, The Hidden Cost of Stock Investing, I break down why time is your biggest risk as a stock investor and how speed of analysis changes the equation.
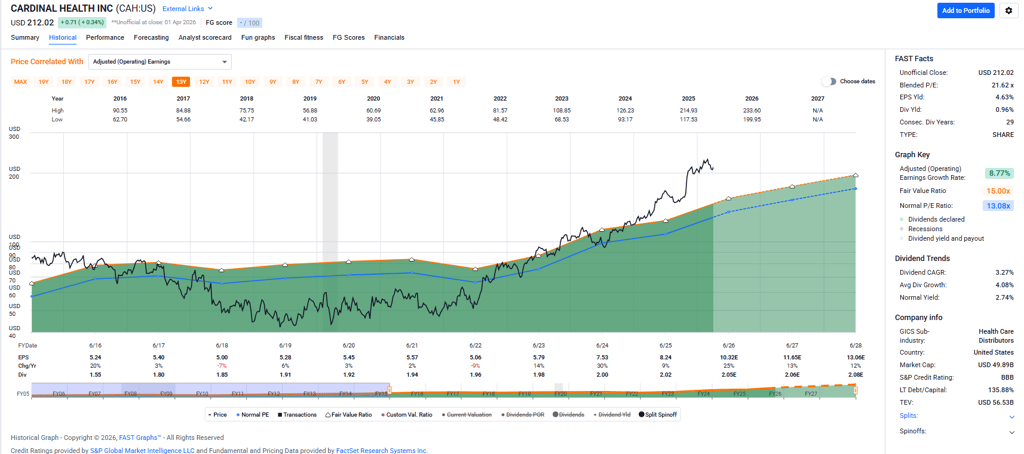
Case Study #1: Cardinal Health (CAH) — Patience Rewarded
Let me walk you through a real investment that illustrates these principles perfectly.
The Setup (2020):
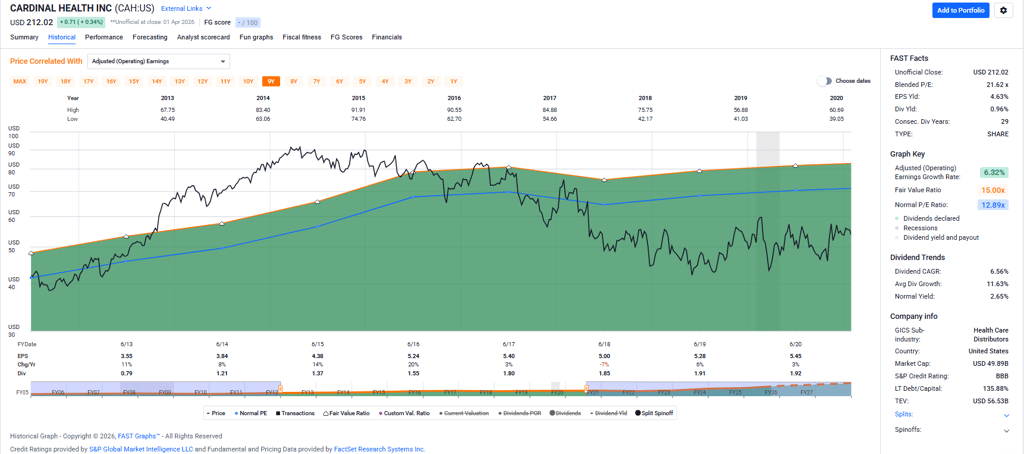
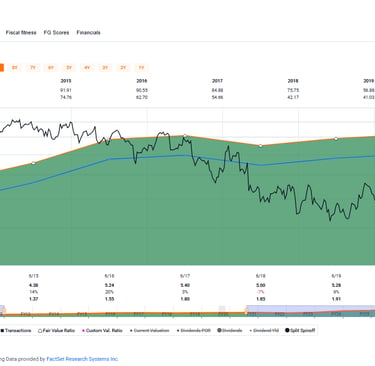
In 2020, Cardinal Health was trading at roughly $50 per share. The company's P/E ratio had compressed down to about 9x earnings, well below its historical average. Earnings were flat, but they weren't declining. The market had gotten pessimistic about the company's near-term prospects and priced the stock accordingly. The dividend yield was 3.5% at a payout ratio of 35%.
A 3.5% yield doesn't turn heads. It's not exciting. But look at the context: the payout ratio was only 35%, meaning the dividend was well-covered. The company was paying out roughly a third of its earnings. Even if earnings dipped, the dividend had a safety net.
This is what the FAST Graph for CAH looked like back then:
The Thesis:
Analyst forecasts in FAST Graphs showed expected earnings growth in the coming years. The stock is under its normal P/E (blue line). The dividend appeared safe and had room to grow. When earnings growth materialized (or the P/E simply reverted to normal), the stock would reprice higher.
The Result (Today):
Today, Cardinal Health trades at over $200 per share. That's a 300%+ capital gain from the 2020 entry point. And here's the beautiful part about dividend growth: the dividend has continued to grow alongside earnings. An investor who bought at $50 with a 3.5% starting yield now has a yield on cost of approximately 4%, and the income keeps growing.
The total return, combining capital gains and growing dividend income, has been exceptional. Not because the starting yield was flashy. Because the fundamentals were sound.
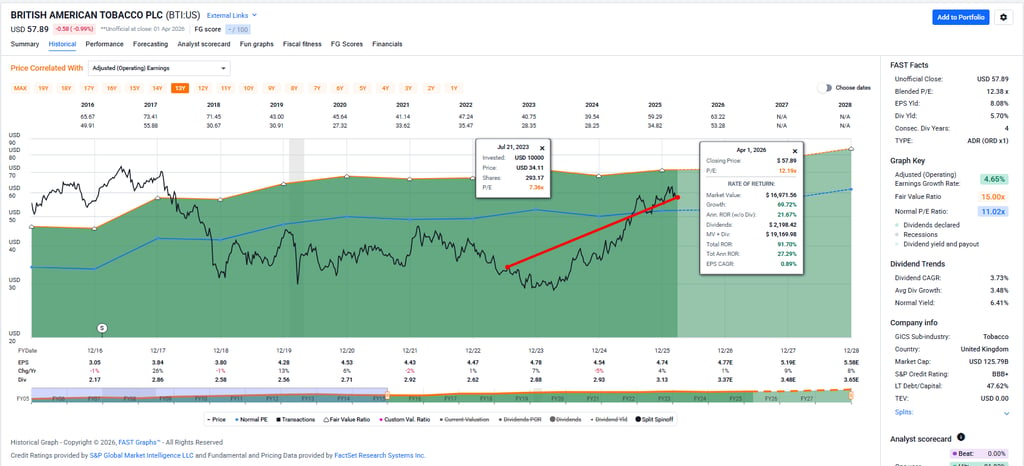
Case Study #2: British American Tobacco (BTI) — Bought the Fear
The Setup (2024):
British American Tobacco was trading at under $35 per share in 2024. This is a company with remarkably consistent earnings and free cash flow, yet the market had beaten the stock down over ESG concerns and regulatory fears around tobacco. The yield was 8% at a 60% payout ratio.
Now, I know what you might be thinking. "Wait, you just said high yield can be a trap. 8% is high."
You're right. And that's exactly why you look at the other pillars. The payout ratio was ~60%. Not 90%. Not 120%. The company was earning well more than enough to cover the dividend. Earnings and free cash flow were consistent, not declining. The high yield was almost entirely a function of the compressed P/E, not deteriorating fundamentals.
The Thesis:
When you see a company with consistent earnings, a moderate payout ratio, and a P/E that's been compressed far below its historical average for reasons that don't impair the business's ability to generate cash, you have a setup for a return to normal. The dividend gives you income while you wait.
The Result (Today):
BTI has recovered to approximately $55 per share. That's about a 57% capital gain in roughly a year. The P/E reverted toward its "normal multiple," which is exactly what you'd hope for when buying a compressed stock. And the yield on cost for that original purchase? Approximately 9% and growing.
The investor who bought BTI at $35 is now collecting 9 cents in annual dividends for every dollar they invested. That's the power of buying dividend growth stocks when they're undervalued.
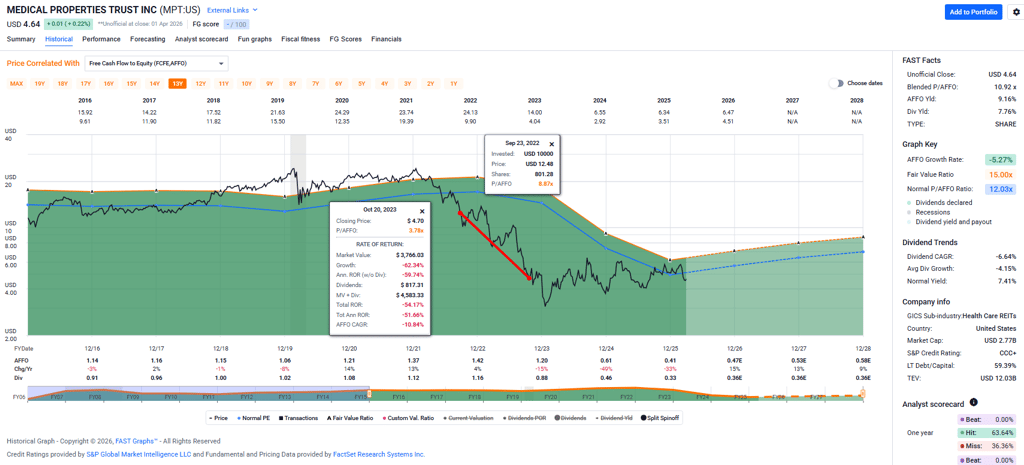
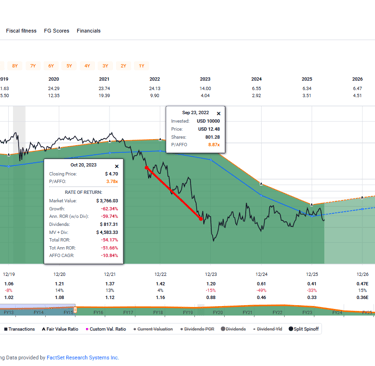
Case Study #3: Medical Properties Trust (MPT) — The Painful Lesson
Now for the one that hurt. Because this is just as important, maybe more so.
The Setup (2022):
Medical Properties Trust is a real estate investment trust (REIT) that owns and leases hospital buildings to healthcare operators. In 2022, the stock was declining from around $12, and the dividend yield was climbing above 10%.
On the surface, this looked like another compressed P/E story. Analysts were forecasting stable earnings. The yield was enormous. It felt like the same playbook as BTI.
What Went Wrong:
The critical difference was that the fundamentals were deteriorating, not just the price. MPT's largest tenant, Steward Health Care, was on the verge of bankruptcy. The warning signs were there: a yield above 10% that kept climbing as the price fell was the market's way of screaming that something was deeply wrong.
I dollar-cost averaged down. I "caught a falling knife," as the saying goes. Each time the price dropped, the yield looked even more attractive, and I added to the position, thinking I was buying a bargain.
Then the dominoes fell:
Steward Health Care entered bankruptcy proceedings
Analysts revised their earnings expectations sharply lower
MPT cut its dividend
The yield on cost, which had looked spectacular on paper, dropped to approximately 2.5%
The stock fell from $12 to $5. The dividend, the entire reason for owning the stock, was gutted.
The Lesson:
The FAST Graphs chart of MPT above tells a sobering story. The red line shows when I was struggling with this one. This is why yield alone isn't enough. MPT had a yield that made CAH's 3.5% look boring. But CAH's 3.5% yield was backed by a 35% payout ratio and stable earnings. MPT's 10%+ yield was a distress signal.
The things that would have saved me:
A deeper look at tenant concentration risk (business quality beyond just earnings)
Skepticism toward a yield that seemed too good to be true
Recognizing that analysts can be wrong, and when a stock keeps falling despite "stable" forecasts, the market may know something the analysts haven't priced in yet
Yield on Cost: Why "Boring" Dividends Become Extraordinary
Let me circle back to a concept I've mentioned a few times: yield on cost (YOC).
The formula is simple:
Yield on Cost = Current Annual Dividend ÷ Original Purchase Price
This is different from current yield, which uses today's stock price. YOC tells you the return on your original investment, expressed as income.
Here's why this matters:
Example: A "Boring" 3% Yield
You buy a stock at $100/share. It pays $3/year in dividends (3% yield). The company grows its dividend by 7% per year. By year 10, the dividend is $5.90/share, and by year 20, it's $11.61/share.
That "boring" 3% yield is now paying you 11.6% per year on your original investment. Without touching the stock. Without adding a dime. Just from the company growing its earnings and dividends over time.
This is the cheat code of dividend growth investing.
You don't need to chase 8% yields that might blow up. You need quality companies with moderate yields, strong earnings growth, and safe payout ratios. Time does the rest.
And this is exactly what FAST Graphs helps me evaluate. Within seconds, I can pull up a company's earnings growth rate, dividend growth rate, payout ratio history, and analyst forecasts. I can see whether that "boring" 3% yield has the engine behind it to become an 8% or 10% yield on cost in a decade.
If you want to try it yourself, FAST Graphs is offering 25% off with code AFFILIATE25.
Putting It All Together: A Checklist for Dividend Growth Stocks
Before I invest in any dividend stock now, I run through this checklist:
Earnings Growth: Is the company growing earnings? Do analysts expect that to continue?
Payout Ratio: Is it under 60-65%? Is there a cushion if earnings dip temporarily?
Valuation: Is the P/E compressed below historical norms? Am I buying at a reasonable price?
Dividend History: Has the company consistently grown its dividend? For how many years?
Business Quality: Is the underlying business durable? Are there concentration risks or structural headwinds?
Total Return Potential: Am I accounting for both dividend income AND capital appreciation?
That last point is critical. Total return matters most. A stock that yields 2% but appreciates 15% per year beats a stock that yields 8% but goes nowhere or declines. Never lose sight of the full picture.
Getting Started
If you don't have a brokerage account yet and want to start building a dividend growth portfolio, TastyTrade is a solid platform to get started. They're currently offering up to $100 for opening and funding a new account, which is a nice way to add a few extra dollars to your first investment.
Key Takeaways
High yield is not the same as good yield. A yield above 8-10% is often a warning sign, not a gift.
Earnings growth is the engine that drives dividend growth. Without it, dividends stagnate or get cut.
Payout ratio is your safety margin. The lower it is, the more room for dividend growth and protection during downturns.
Buy at the right valuation. P/E compression creates opportunity, but only when the underlying business is sound.
Yield on cost is the long game. A 3% yield today can become a 10%+ yield on cost through the power of dividend growth.
Total return always matters. Dividends are part of the picture, not the whole picture.
Tools like FAST Graphs compress your research time so you can evaluate these factors in seconds instead of hours. (Read more about why research speed matters in The Hidden Cost of Stock Investing.)
If you found this useful, I write about this stuff regularly. My newsletter, Portfolios & Bedtime Stories, is where I share the stocks I'm actually buying, the analysis behind each decision, and the investing lessons learned along the way. I'd love to have you along for the ride.
Affiliate Disclosure: This article contains affiliate links to FAST Graphs and TastyTrade. If you sign up through these links, I may receive compensation at no additional cost to you. I recommend these tools because I use them personally and believe they provide real value. Your support helps keep CheatCode Wealth running and free for everyone.
Disclaimer: This article is for educational and informational purposes only and should not be construed as financial advice. I am not a licensed financial advisor. The case studies discussed (CAH, BTI, MPT) reflect historical observations and are not recommendations to buy, sell, or hold any security. All investing involves risk, including the possible loss of principal. Past performance does not guarantee future results. Please consult with a qualified financial professional before making any investment decisions.
Stay Connected
Want more strategies for building wealth without sacrificing your life?
Join my free newsletter, Portfolios and Bedtime Stories, where I share practical money advice for people who refuse to trade their family time for a bigger paycheck.
Garrett Duyck is the founder of CheatCode Wealth and the writer behind the Portfolios & Bedtime Stories newsletter. He writes for employed people who want to build wealth without quitting their job, burning out, or missing out on life. Garrett is a former contributor to Seeking Alpha, where he built an audience of more than 4,000 readers, and he has published more than 140 articles about investing, passive income, and personal finance. He was among the top 20% of analysts according to TipRanks.
He has built a portfolio of income-producing assets that generates more than $50,000 per year in passive income, and he and his wife have paid off more than $180,000 in non-mortgage loans while raising four children. Garrett grew up in poverty, became a first-generation college graduate, and believes the best money strategies are the ones real families can actually stick with over time.
Educational Disclosure: CheatCode Wealth content is for educational and informational purposes only. It is based on personal experience, research, and firsthand investing practice. It is not personalized financial, legal, tax, or investment advice. Always perform your own due diligence and consult with a licensed professional before making significant financial decisions.
Affiliate Disclosure: To support the site, some links in our articles may be affiliate links. If you click on these and make a purchase, CheatCode Wealth may receive a small commission at no additional cost to you. We only recommend tools and services that Garrett has personally used or thoroughly vetted for the CheatCode community.
New to CheatCode Wealth? Start with our Paycheck-to-Passive guide to see how we build the foundation.
Connect & Explore:
Learn more about Garrett · Explore wealth-building tools · Garrett’s Seeking Alpha Archive · Connect on LinkedIn
About the Author

Subscribe to the newsletter and get a free copy of 101 Money Cheat Codes:
Spam-free. Unsubscribe anytime.
CheatCode Wealth™
Build your wealth. Keep your life.
© 2025. All rights reserved. Cheatcode Wealth LLC. This webpage may contain paid affiliate links.